Coppell ISD enrollment and budget dashboard
Enrollment, transfers, budget, and growth projections from scattered public reports, on one site anyone can explore.
Built on my own time from public data. Not an official Coppell ISD publication. These screens are the live site.
The situation
A school district's numbers are public, but they live in different places: state enrollment files, budget reports, a demographer's projections, census tables, and attendance-zone maps. A simple question, like which schools are growing, where transfers go, or what recapture costs, means pulling from several of them at once.
Nobody asked for this, and nobody paid for it. I live in the district, so I built it on my own time and coordinated with the district so it would answer the questions its leaders weigh when they plan.
What I built
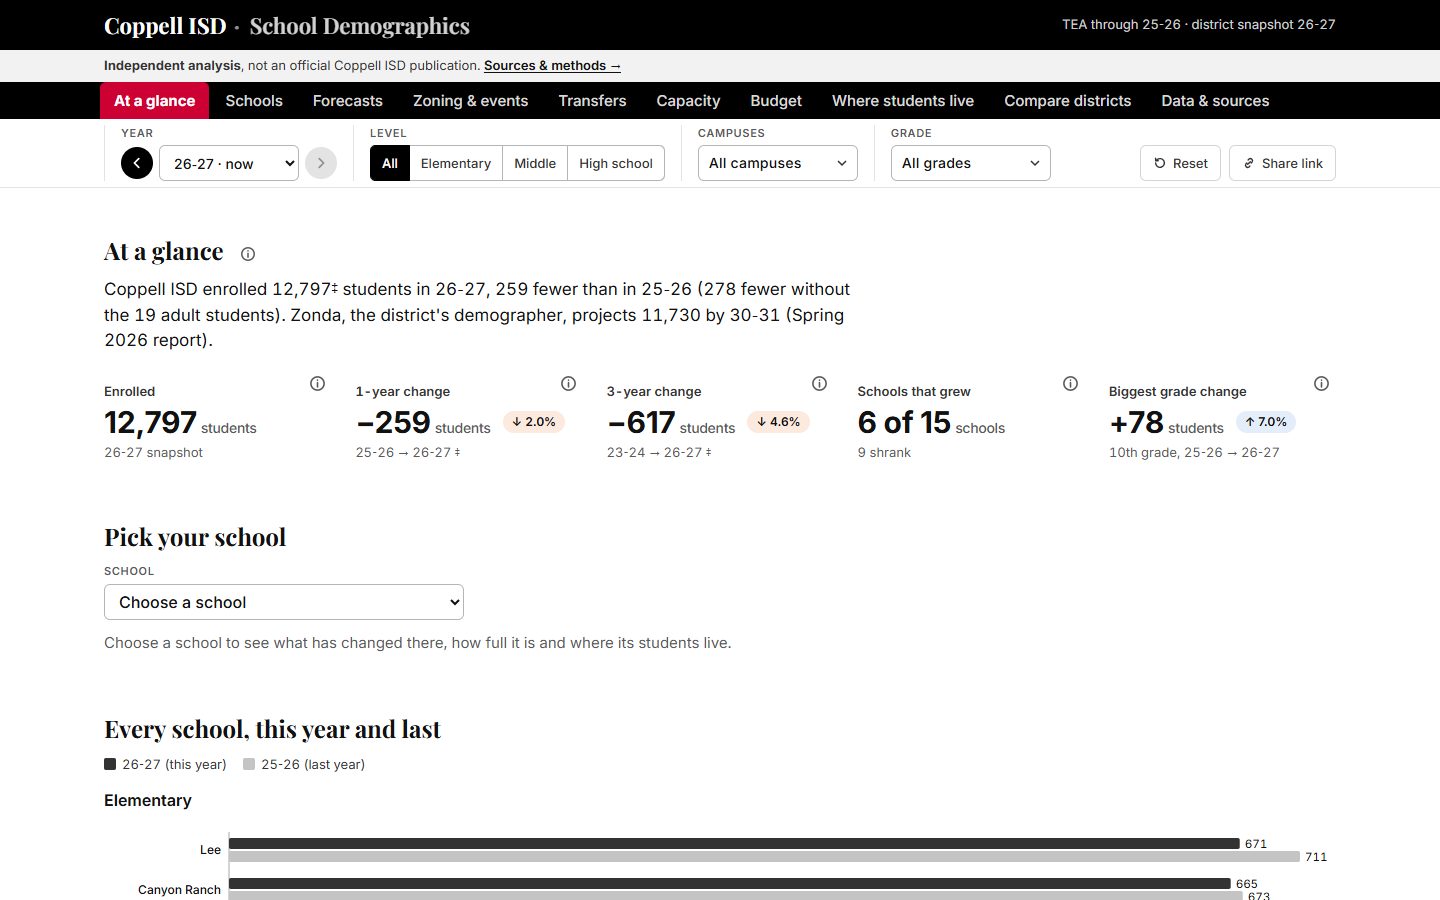
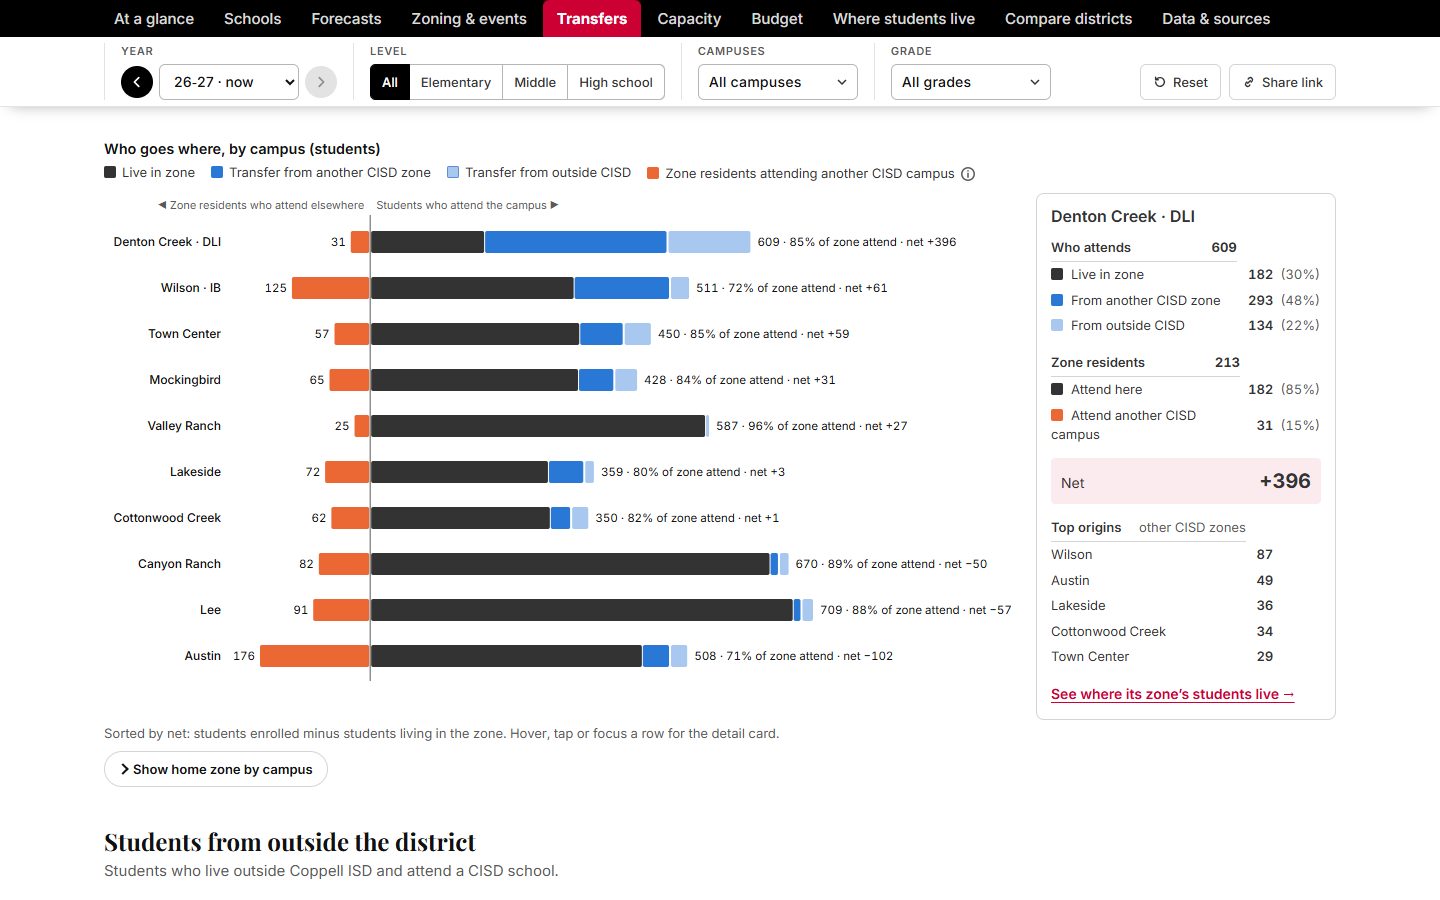
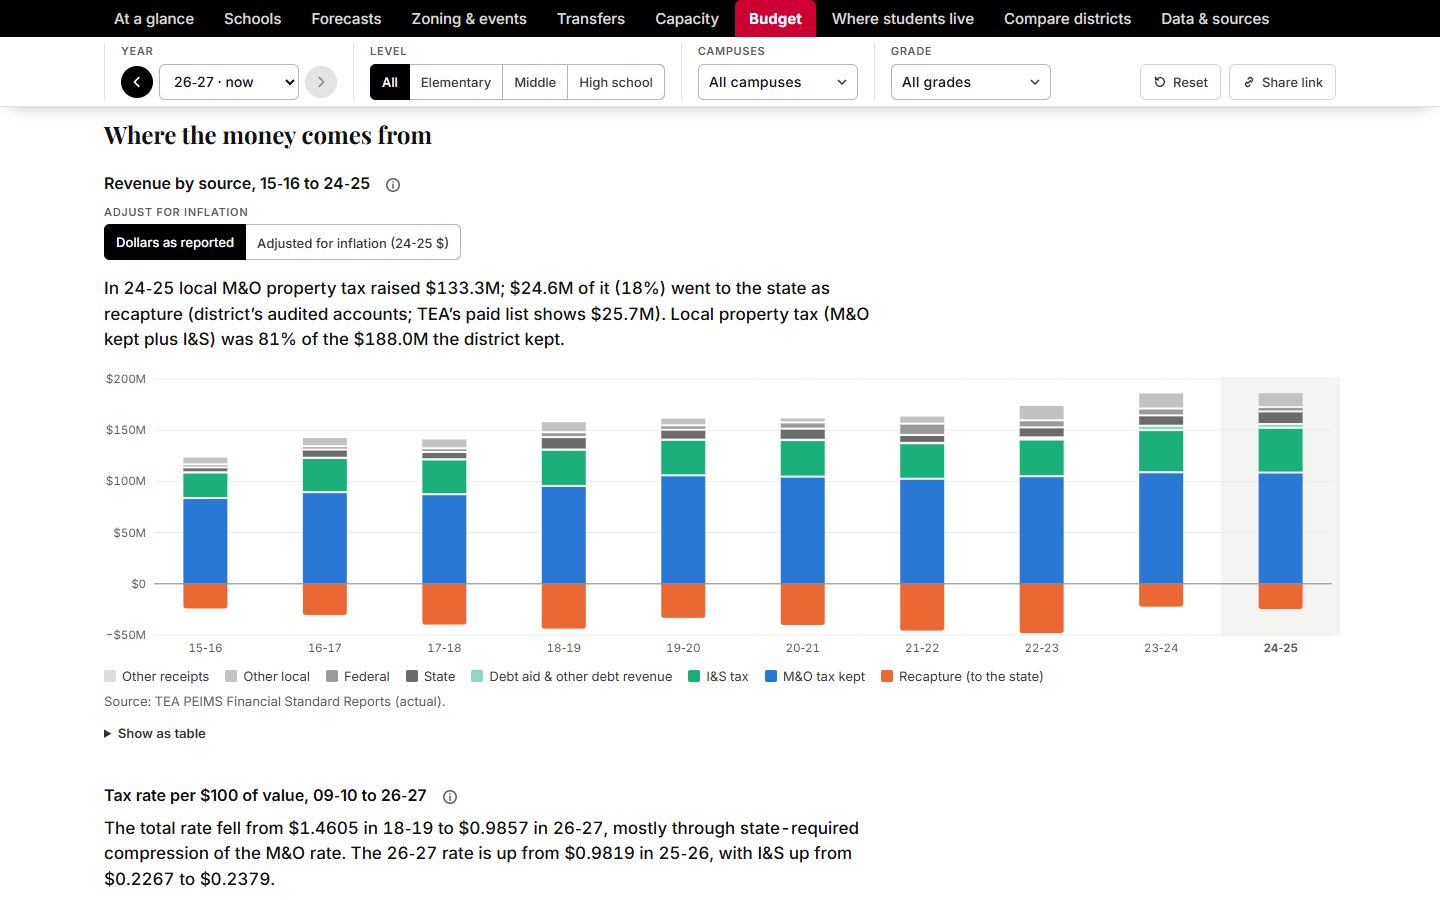
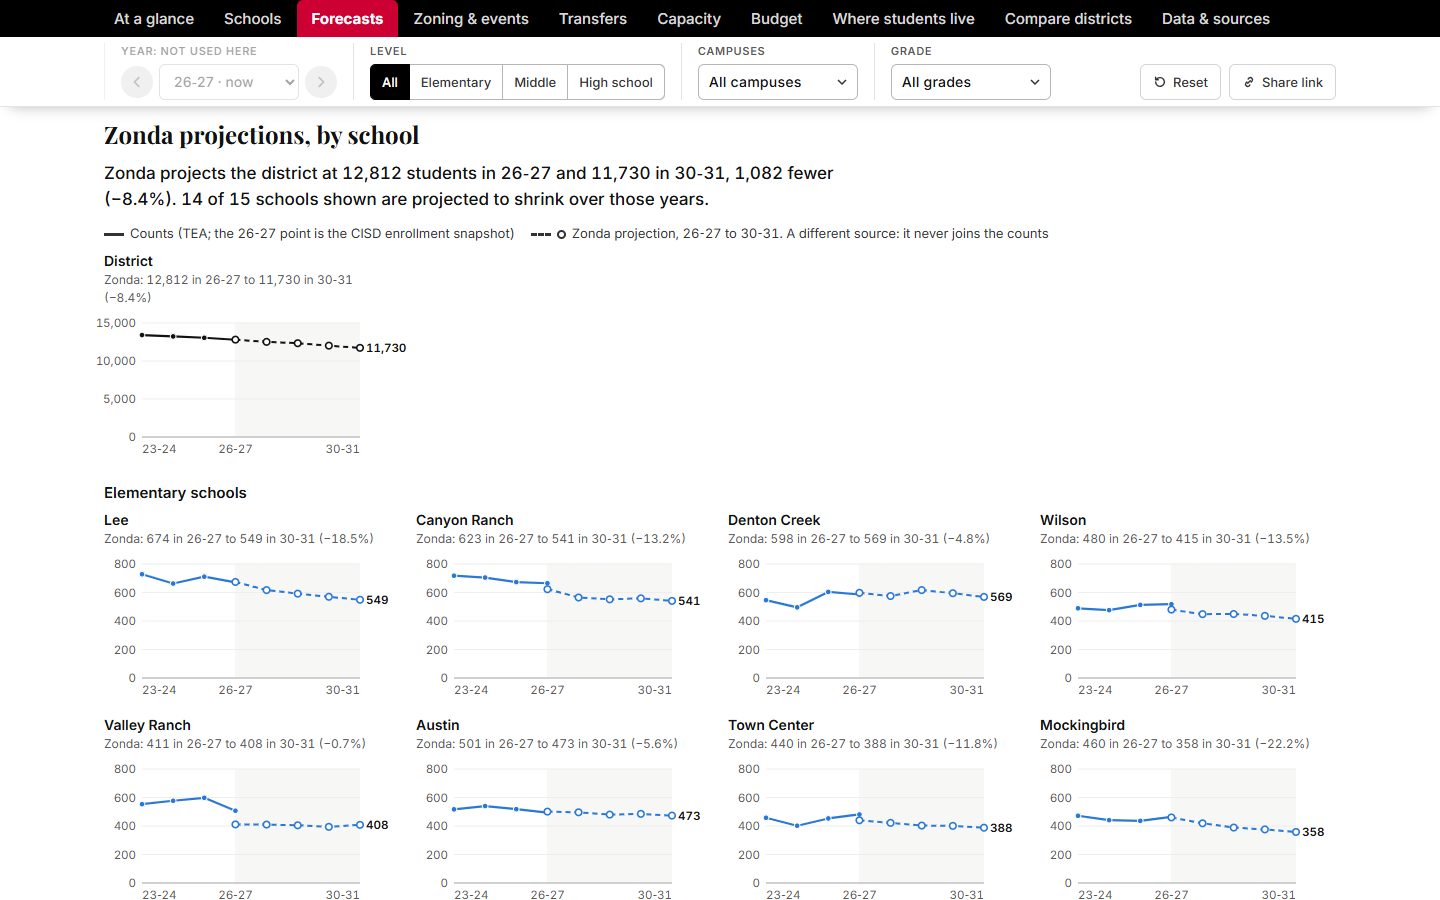
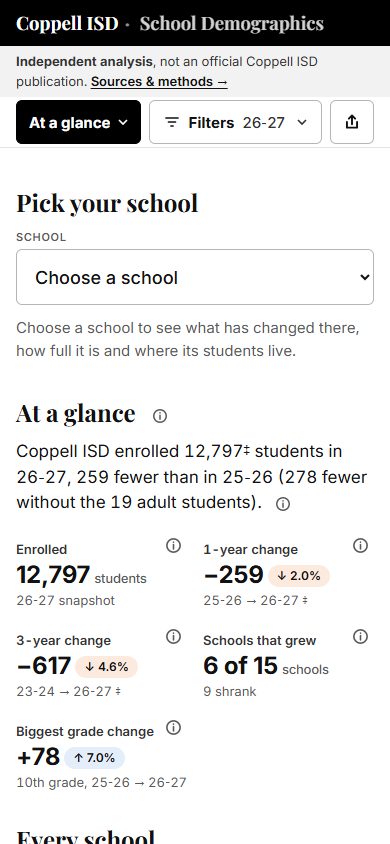
- One site that brings it together: enrollment by campus and grade for four school years, transfers in and out of every campus, ten years of budget actuals (where the money comes from and where it goes, reserves, recapture, and bonds), the demographer's projections, and census data on where students live.
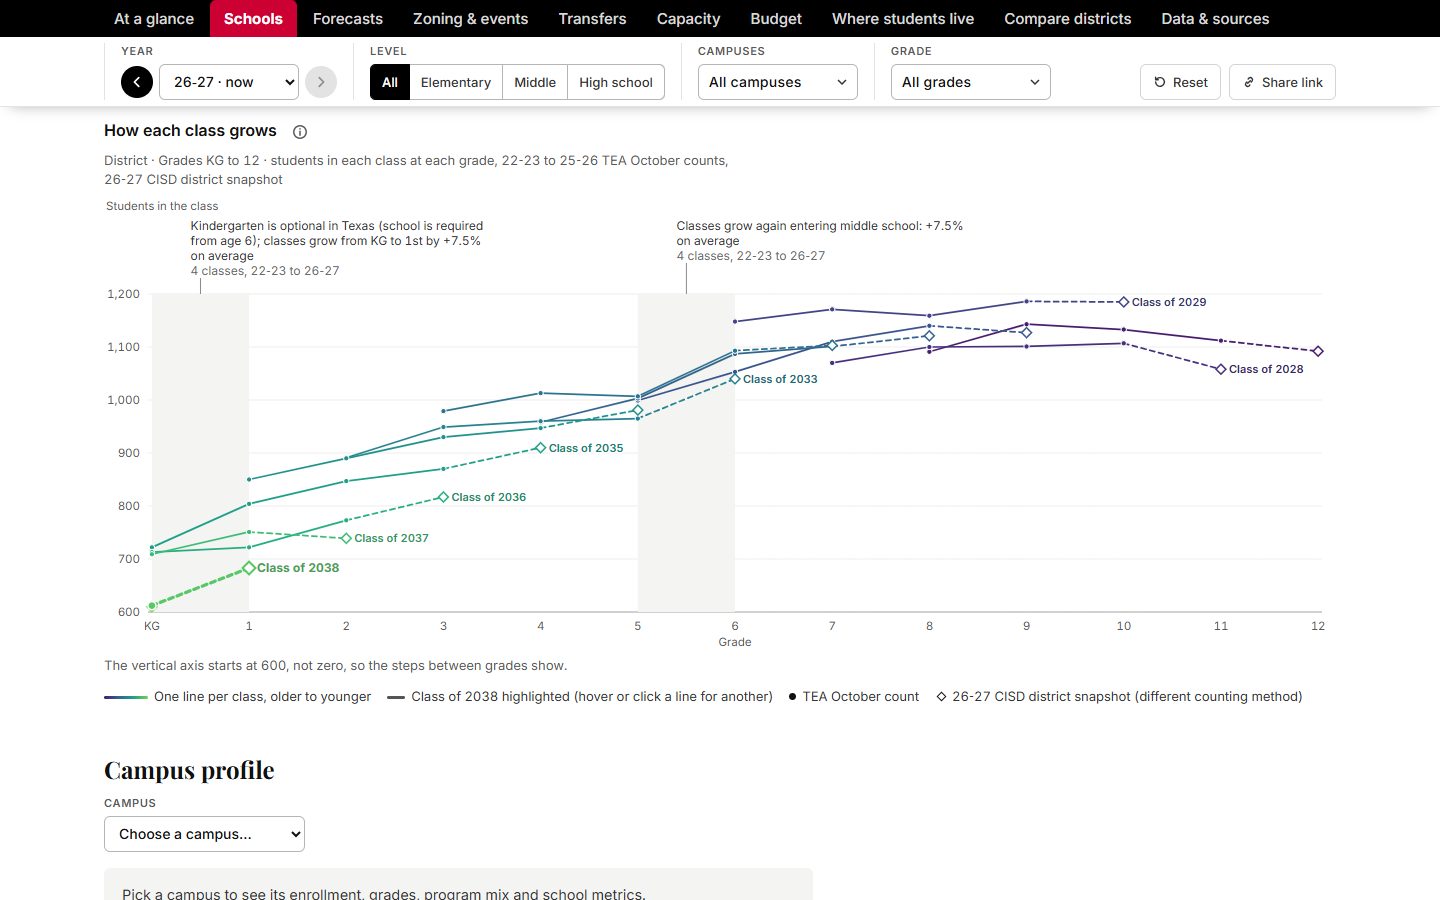
- Cohort charts that follow each class from kindergarten to 12th grade, so the grades where enrollment jumps or drops stand out, with projections set next to how accurate past forecasts turned out to be.
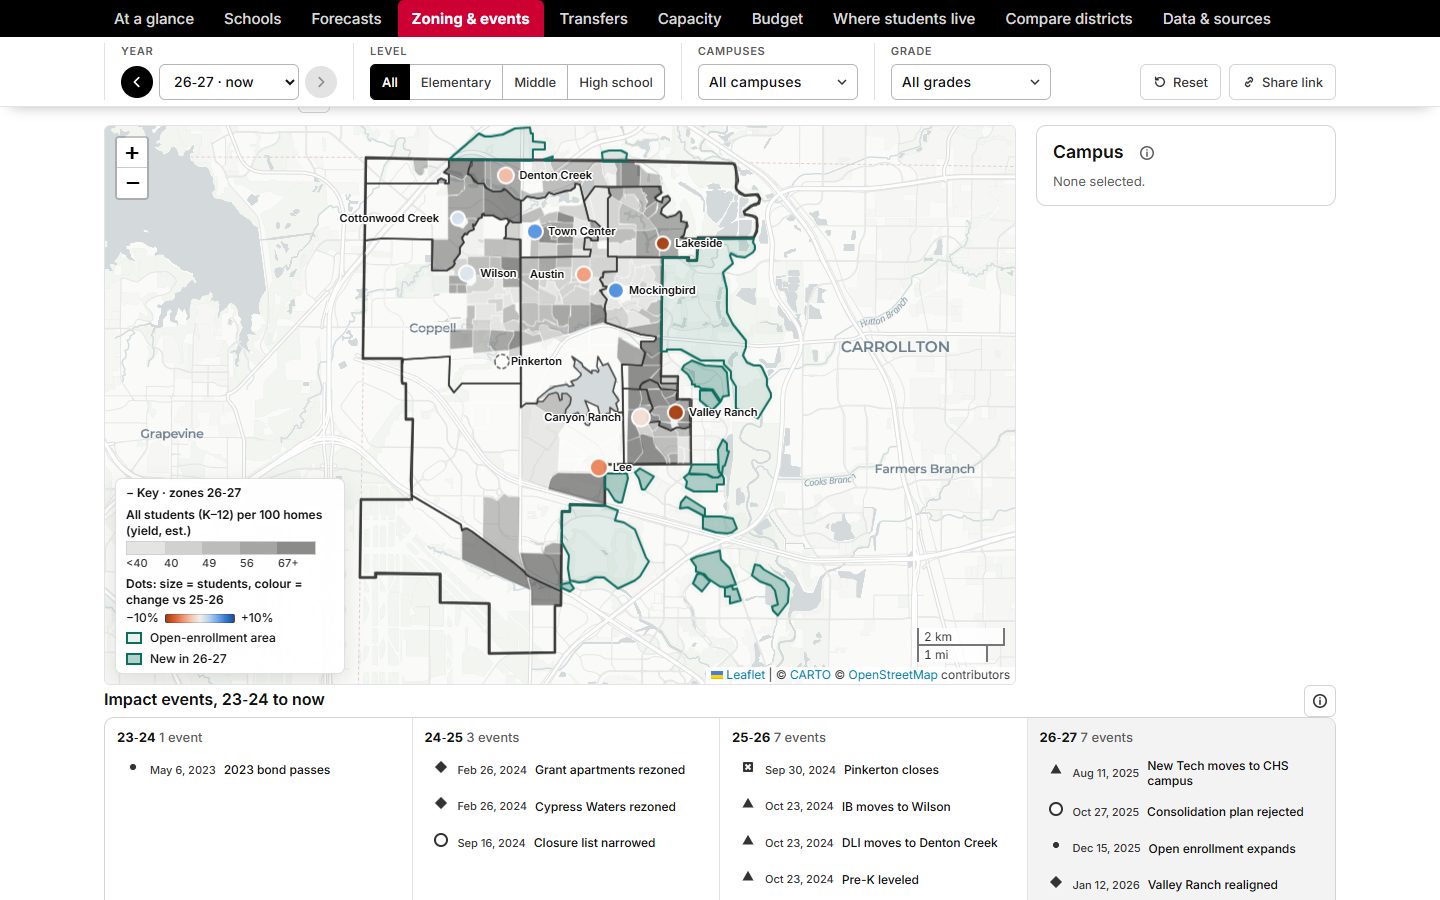
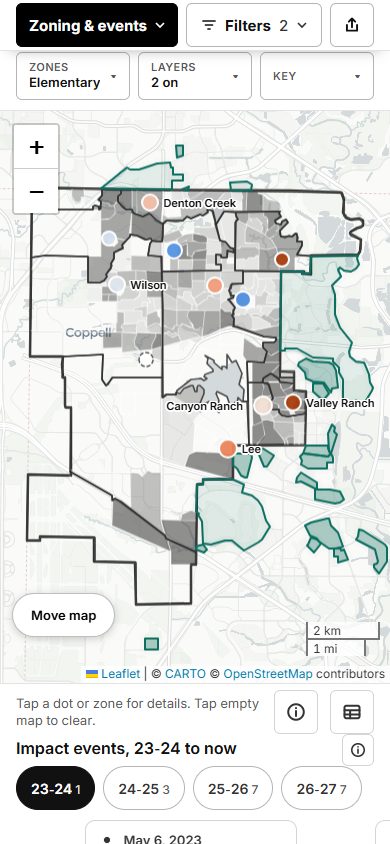
- A map of every attendance zone, how many students each neighborhood sends per 100 homes, and each rezoning, closure, and program move since 2023-24.
- Views filter by year, level, campus, and grade where they apply, any view can be shared as a link, and every figure lists its source.
State files hide counts for very small groups of students to protect their privacy. The site fills a hidden count from the state's other published figures where it can, marks anything estimated, and footnotes where each total comes from.
Try it
Two charts from the live dashboard, rebuilt here with the same data. Hover or tap a line to follow one class, or pick a year on the budget chart for its breakdown.
How each class grows, kindergarten to 12th grade
Students in each class at each grade. TEA October counts 2022-23 to 2025-26; the dashed step and diamond are the district's 2026-27 snapshot, counted a different way. Shaded bands show the average change for that step across classes, from TEA counts. The scale starts at 600, not zero, so the steps between grades show.
Show as table
* District snapshot, 2026-27.
Operating spending by function, 2015-16 to 2024-25
Source: TEA PEIMS Financial Standard Reports (actual), not adjusted for inflation.
Show as table
The result
I shared it with the district as a planning resource. They asked if they could share it with their staff.
For your business
Your numbers are scattered too: sales by product, jobs by crew, costs by month. The same approach puts them on one screen you can filter, share, and trust.
Why custom
Off-the-shelf dashboard tools assume the data is already clean and in one place, and they charge for every viewer. This data came from many public sources in different formats, and it had to be free for anyone to open on a phone. A custom site did both.
Built with
D3 charts · Leaflet and MapLibre maps · plain JavaScript · GitHub Pages · built with Claude Code
Have a workflow like this?
Scoping a project costs nothing, and most take a 30-minute call. Tell me where the time goes.